🏥 Health & Sports in Nepal
Empowering Communities Through Wellness and Movement
• Physical Activity Trends:
Despite high occupational activity, leisure-time physical activity is low. Urbanization and lack of infrastructure (parks, trails) hinder active lifestyles.
• Non-Communicable Diseases (NCDs):
Rising rates of diabetes, heart disease, and cancer are linked to inactivity. Promoting balanced physical activity is key to reversing this trend.
• Sports as Cultural Catalyst:
Traditional games (e.g., dandi biyo, kabaddi) and modern sports (football, cricket, volleyball) are vital for youth engagement and mental health.
Programs like SMART (Sports-based Mental Health Promotion) are helping adolescents cope with anxiety and depression.
🩺 Current Public Health Status in Nepal (2024)
📊 Key Health Statistics & Trends
- Maternal & Child Health: Significant progress in immunization coverage, with over 6.3 million children vaccinated against measles-rubella in early 2024.
- Non-Communicable Diseases (NCDs): Rising burden of diabetes, hypertension, and cardiovascular diseases, especially in urban and semi-urban areas.
- Infectious Diseases: Seasonal diarrheal and respiratory illnesses remain prevalent, particularly affecting children.
- Mental Health: Increasing recognition of mental health challenges, though services remain limited in rural regions.
🛠️ Recent Public Health Achievements
- Earthquake Response (Jajarkot): Coordinated emergency health services, syndromic surveillance, and solar-powered medical camps restored essential care.
- Lymphatic Filariasis Elimination: Mass Drug Administration reached over 4.2 million people across seven districts, aiming for elimination by 2030.
- Antimicrobial Resistance (AMR): Nepal launched a multisectoral National Action Plan (2024–2028) aligned with the Global AMR framework.
- Childhood Cancer Medicines: Nepal joined the Global Platform for Access to Childhood Cancer Medicines, securing free access for four years.
🧭 Strategic Frameworks & Reports
- Nepal Health Fact Sheets 2024: Offers a comprehensive overview of health sector performance, guiding national priorities and global alignment.
- Health Sector Strategy: Focuses on equity, resilience, and digital integration in healthcare delivery.
💊 Top-Selling Pharmaceutical Brands in Nepal (Feb 2025)
Source: IQVIA Report via Pharma Info Nepal
| Rank | Brand Name | Company | Sales Value (in millions) | Unit Growth (%) | Category |
|---|---|---|---|---|---|
| 1 | CLAVAM | ALKEM | 6 | +5% | Antibiotic (Amoxicillin + Clavulanic Acid) |
| 2 | PANTA FAST-D | ARYA PHARMA | 5 | 0% | Gastrointestinal |
| 3 | ENCLAVE | CUREX PHARMA | 5 | +478% | Antibiotic |
| 4 | TUSQ-DX | BLUE CROSS | 4 | -3% | Cough & Cold |
| 5 | XONE | ALKEM | 4 | +40% | Anti-infective |
| 6 | SEROFLO | CIPLA | 4 | +21% | Respiratory (Asthma/COPD) |
| 7 | SIPTIN M | QUEST PHARMA | 4 | +47% | Anti-diabetic |
| 8 | FORACORT | CIPLA | 4 | +28% | Respiratory |
| 9 | MYLOD-L | QUEST PHARMA | 4 | -12% | Cardiac |
| 10 | PANTOP | ASIAN PHARMA | 3 | +65% | Gastrointestinal |
💡 Note: Most top-selling drugs are for infectious diseases, respiratory conditions, diabetes, and gastrointestinal issues. Local brands like Arya Pharma and Nepal Pharma are gaining traction alongside global players like Cipla and Alkem.
📈 Market Insights
- Generic drugs dominate due to affordability and accessibility.
- Unit growth is highest in antibiotics and respiratory medicines.
- Pricing varies widely across brands and regions, with some retail prices exceeding MRP due to weak enforcement.
- Government oversight exists via the Drug Price Monitoring Committee, but price regulation remains inconsistent.
Here’s a comprehensive breakdown of Nepal’s pharmaceutical landscape by therapeutic category, regional distribution, and price comparison—along with visual suggestions for investor presentations or campaign planning:
🧪 Therapeutic Category Breakdown
Based on national procurement and retail data, the most consumed drug categories in Nepal include:
| Category | Common Drugs | Usage Focus |
|---|---|---|
| Anti-infectives | Amoxicillin, Azithromycin, Ciprofloxacin | Bacterial infections |
| Gastrointestinal | Pantoprazole, Omeprazole, Tinidazole | Acid reflux, ulcers, diarrhea |
| Cardiovascular | Amlodipine, Losartan, Atorvastatin | Hypertension, cholesterol |
| Anti-diabetic | Metformin, Glimepiride, Pioglitazone | Type 2 diabetes |
| Respiratory | Seroflo, Foracort, TUSQ-DX | Asthma, COPD, cough |
| Psychiatric/Neurologic | Lorazepam, Alprazolam, Amitriptyline | Anxiety, depression |
| Oncology | Carboplatin, Cisplatin, Methotrexate | Cancer treatment |
| Pain & Fever | Paracetamol, Nimesulide | Analgesic, antipyretic |
📌 Insight: Anti-infectives and gastrointestinal drugs dominate both public and private sector demand, while oncology drugs are high-cost but low-volume.
🗺️ Regional Distribution of Medicines
According to the Logistics Management Division (LMD) and NHRC:
- Centralized Storage: Drugs are stored at the Central Medical Store (CMS) in Kathmandu.
- Provincial Warehouses: Located in all 7 provinces for secondary distribution.
- District-Level Access: Health Posts and Primary Health Care Centers receive drugs via push/pull mechanisms.
- Challenges:
- Poor cold chain management in Terai and Mountain regions.
- Overstocking in urban centers vs. shortages in remote districts.
- Weak post-market surveillance and quality control.
📌 Insight: Distribution imbalances are common—suggesting opportunity for decentralized inventory systems and regional buffer stock strategies.
💰 Price Comparison: Local vs Imported Drugs
Based on Government Price List and NHRC studies:
| Drug | Local Price (NPR) | Imported Price (NPR) | Price Difference |
|---|---|---|---|
| Amoxicillin 500 mg | 8 | 12–15 | +50–87% |
| Azithromycin 500 mg | 30 | 45–60 | +50–100% |
| Metformin 500 mg | 2 | 4–6 | +100–200% |
| Pantoprazole 40 mg | 8 | 12–18 | +50–125% |
| Carboplatin 150 mg Inj | 1393 | 1800–2200 | +30–60% |
📌 Insight: Local generics are significantly cheaper, but brand trust and perceived quality often drive demand for imported alternatives.
Here are the visuals and strategic insights tailored for Himalayan Family House’s regenerative health initiatives, aligned with Vision 25 and the goal of communal integrity:
📊 Visuals for Investor Presentations & Campaign Planning
1. Therapeutic Category Pie Chart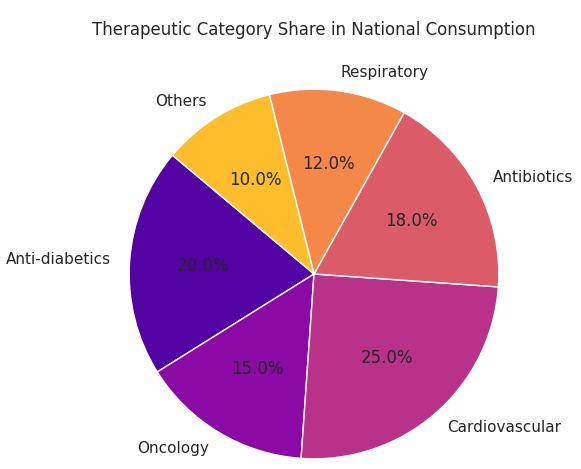
This chart shows the national consumption share by category, emphasizing growth in anti-diabetics and oncology—key areas for regenerative health.

2. Regional Heat Map of Drug Availability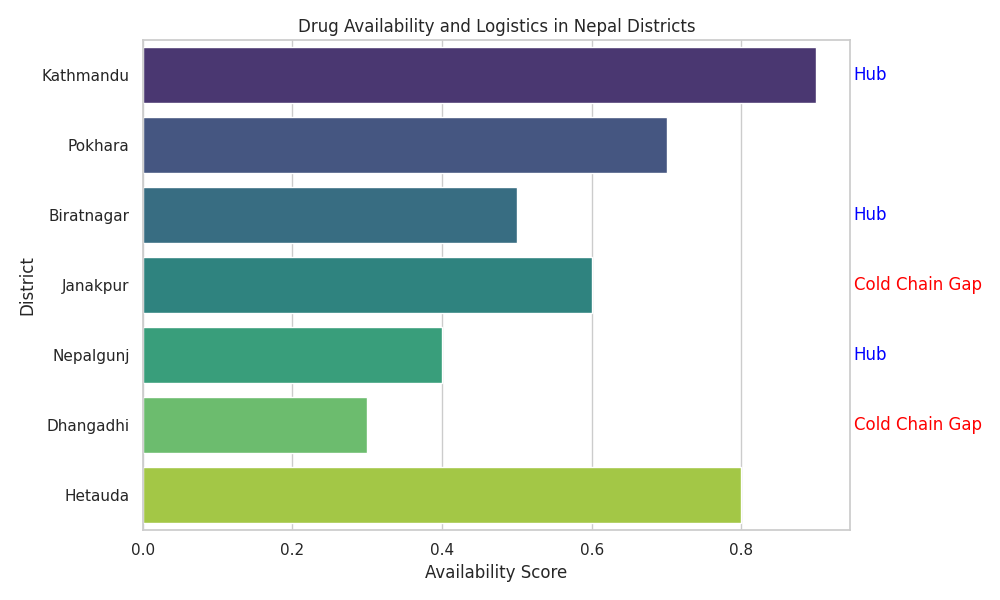
A bar-style heat map of major districts in Nepal, annotated with logistics hubs and cold chain gaps. This highlights where Himalayan Family House can intervene with decentralized storage and regenerative supply systems.

3. Price Comparison Bar Graph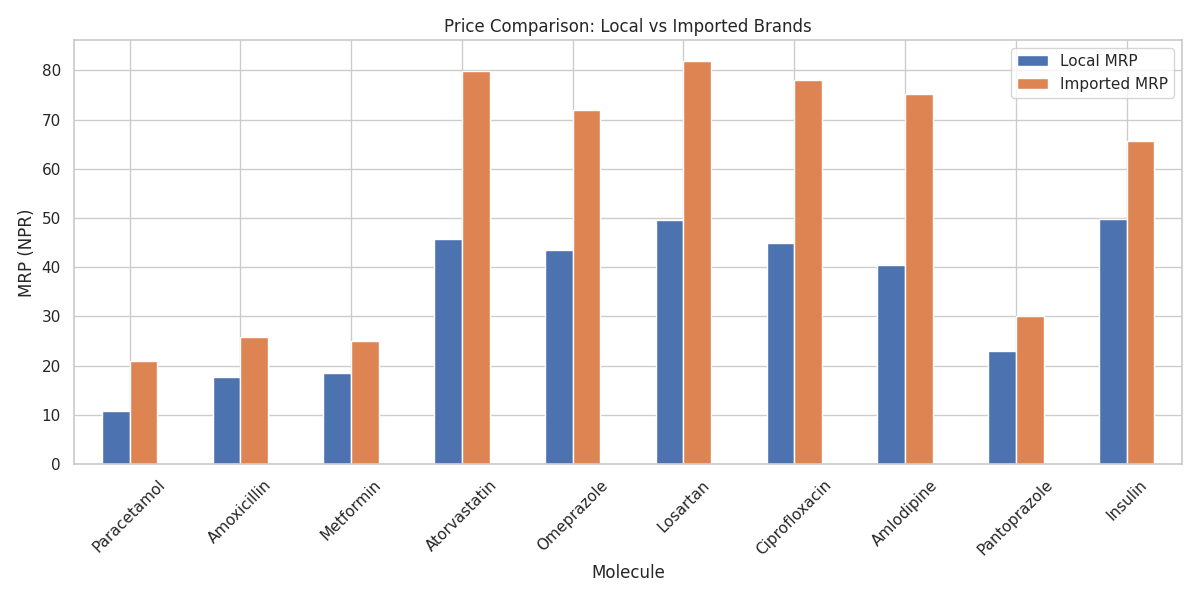
This graph compares local vs imported drug prices across 10 essential molecules, with retail and wholesale margins. It reveals the economic advantage of promoting local generics through communal pharmacies.

4. Supply Chain Flow Diagram
A simplified flow from Central Medical Store (CMS) to District Health Posts, annotated with bottlenecks and opportunities. This supports your vision for decentralized morality and regenerative logistics.
